Drive Business Value with Data
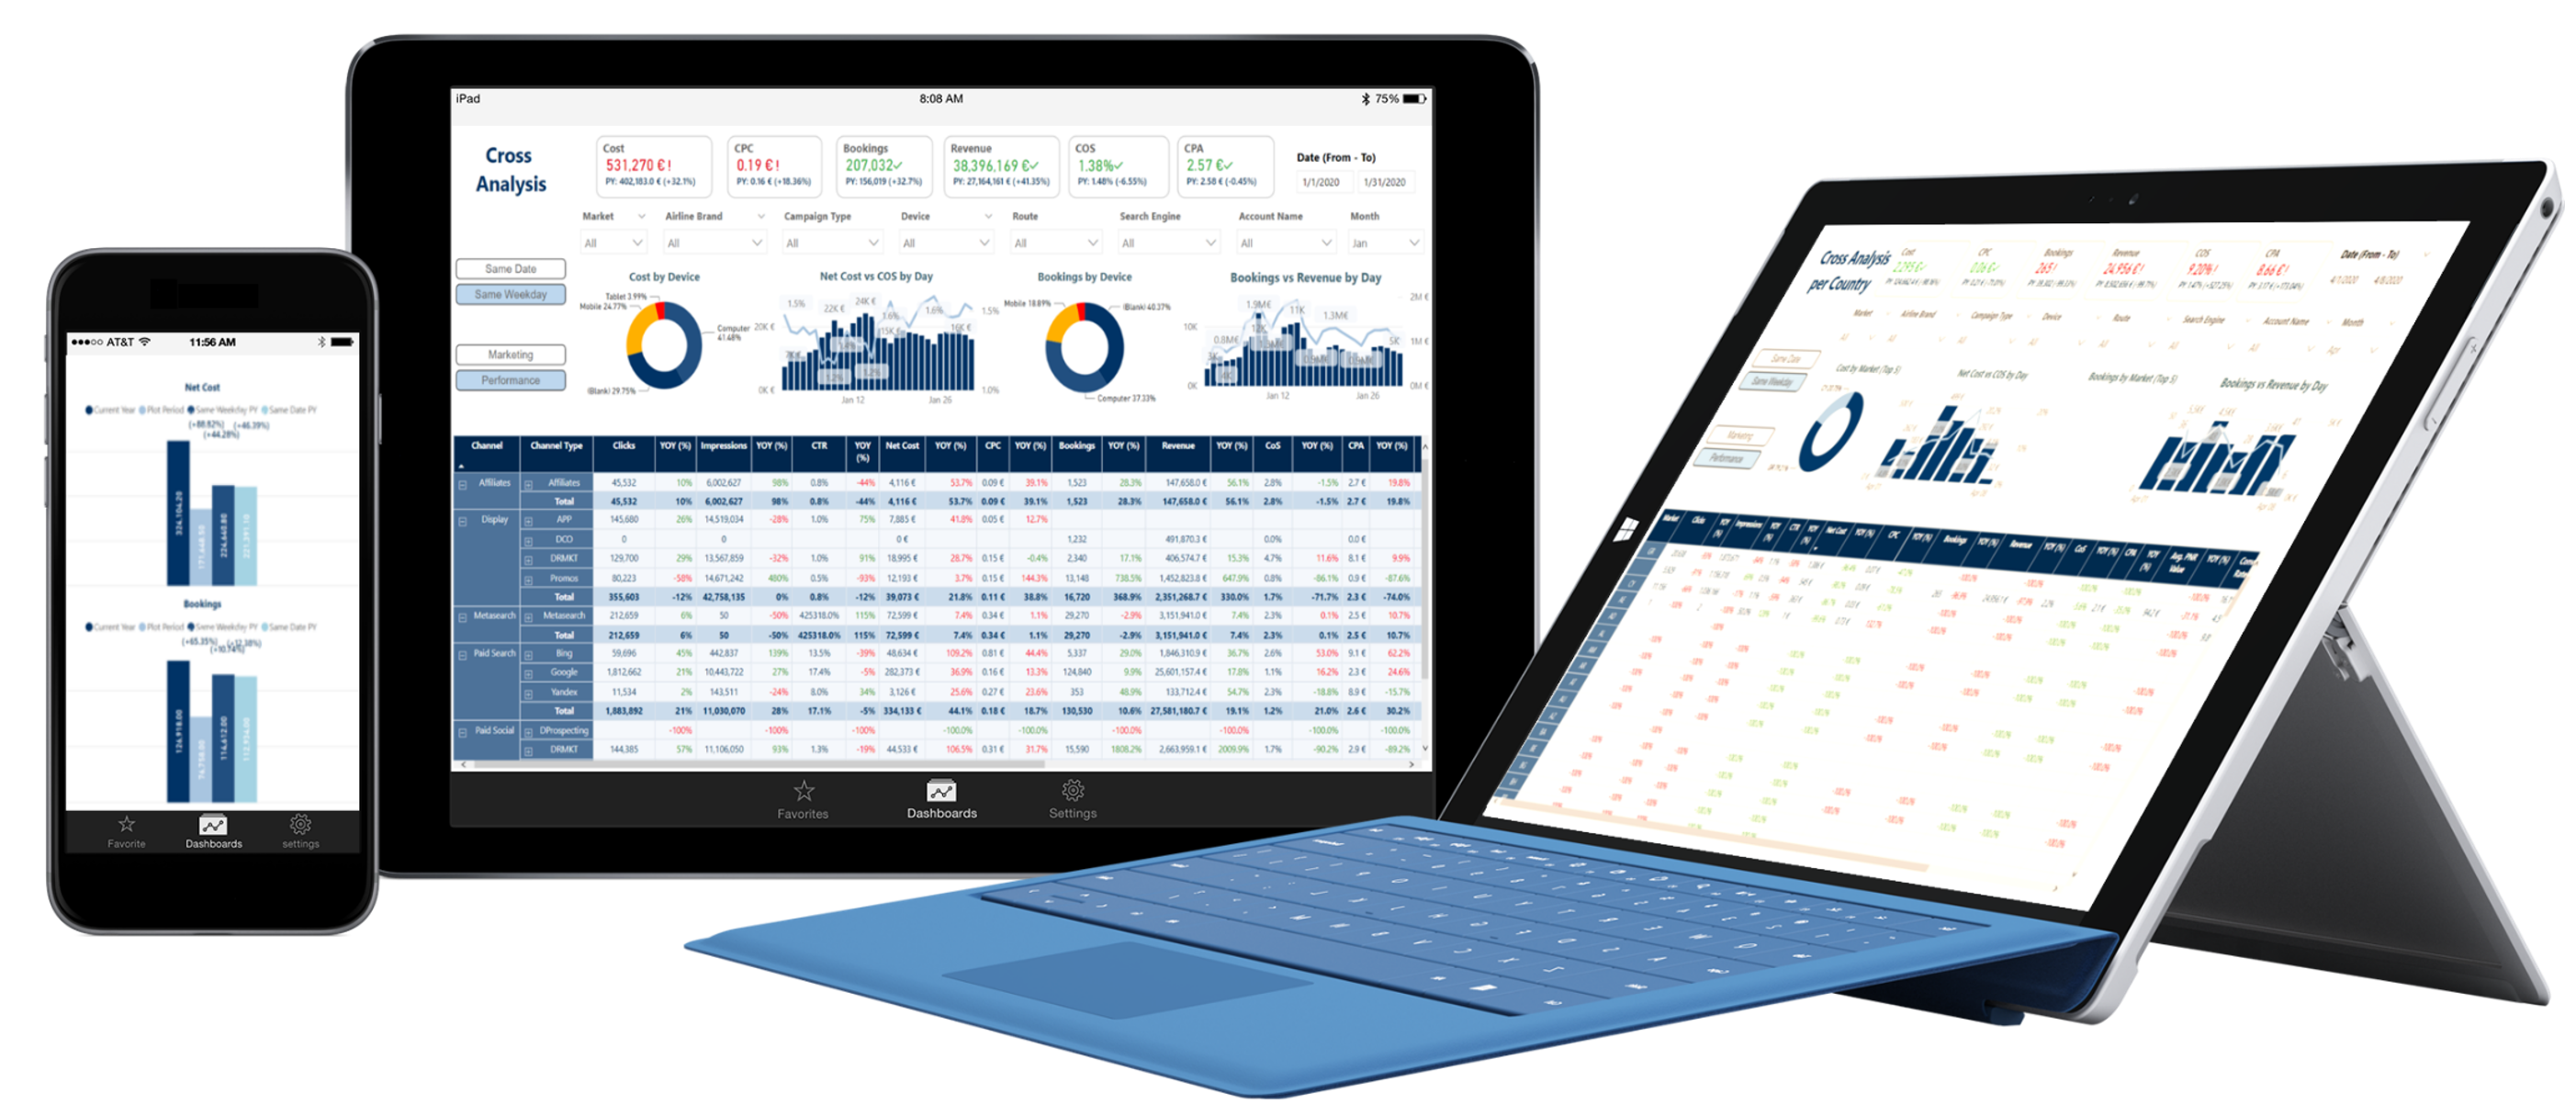
Business Intelligence (BI) and Data Analytics are essential to making strategic business decisions.
Data-driven organizations discover insights hidden in their data, that help them identify areas of revenue loss or where improvements can be made, to make savings or increase profits.
Overall, the key benefits businesses can get from BI and Data Analytics applications include the ability to:
- speed up and improve decision-making;
- monitor KPI’s in real-time;
- increase operational efficiency and productivity;
- spot business problems that need to be addressed;
- optimize internal business processes;
- identify emerging business opportunities and market trends;
- identify new revenue streams;
- drive higher sales;
- gain a competitive edge over rival companies; and
- develop robust and data-backed business strategies.
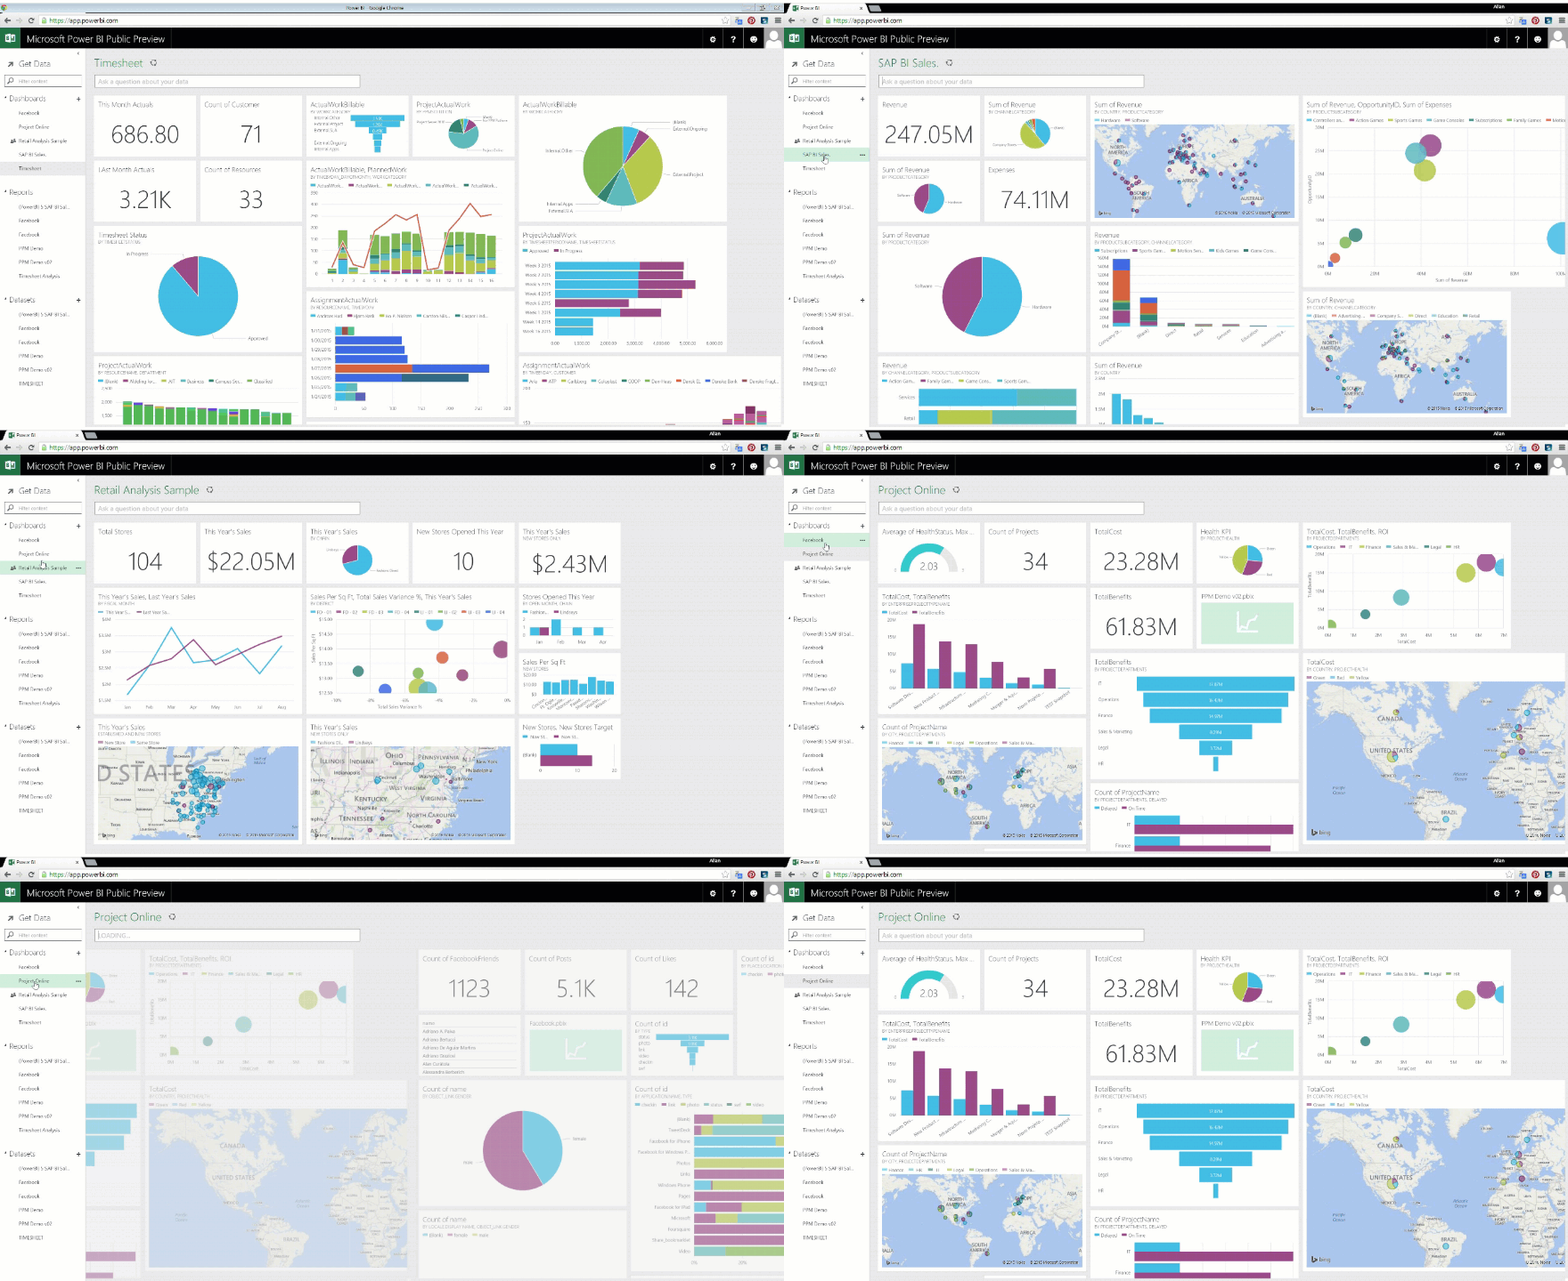
Transforming data to useful insights for decision making
Business Intelligence for different Airline Functions
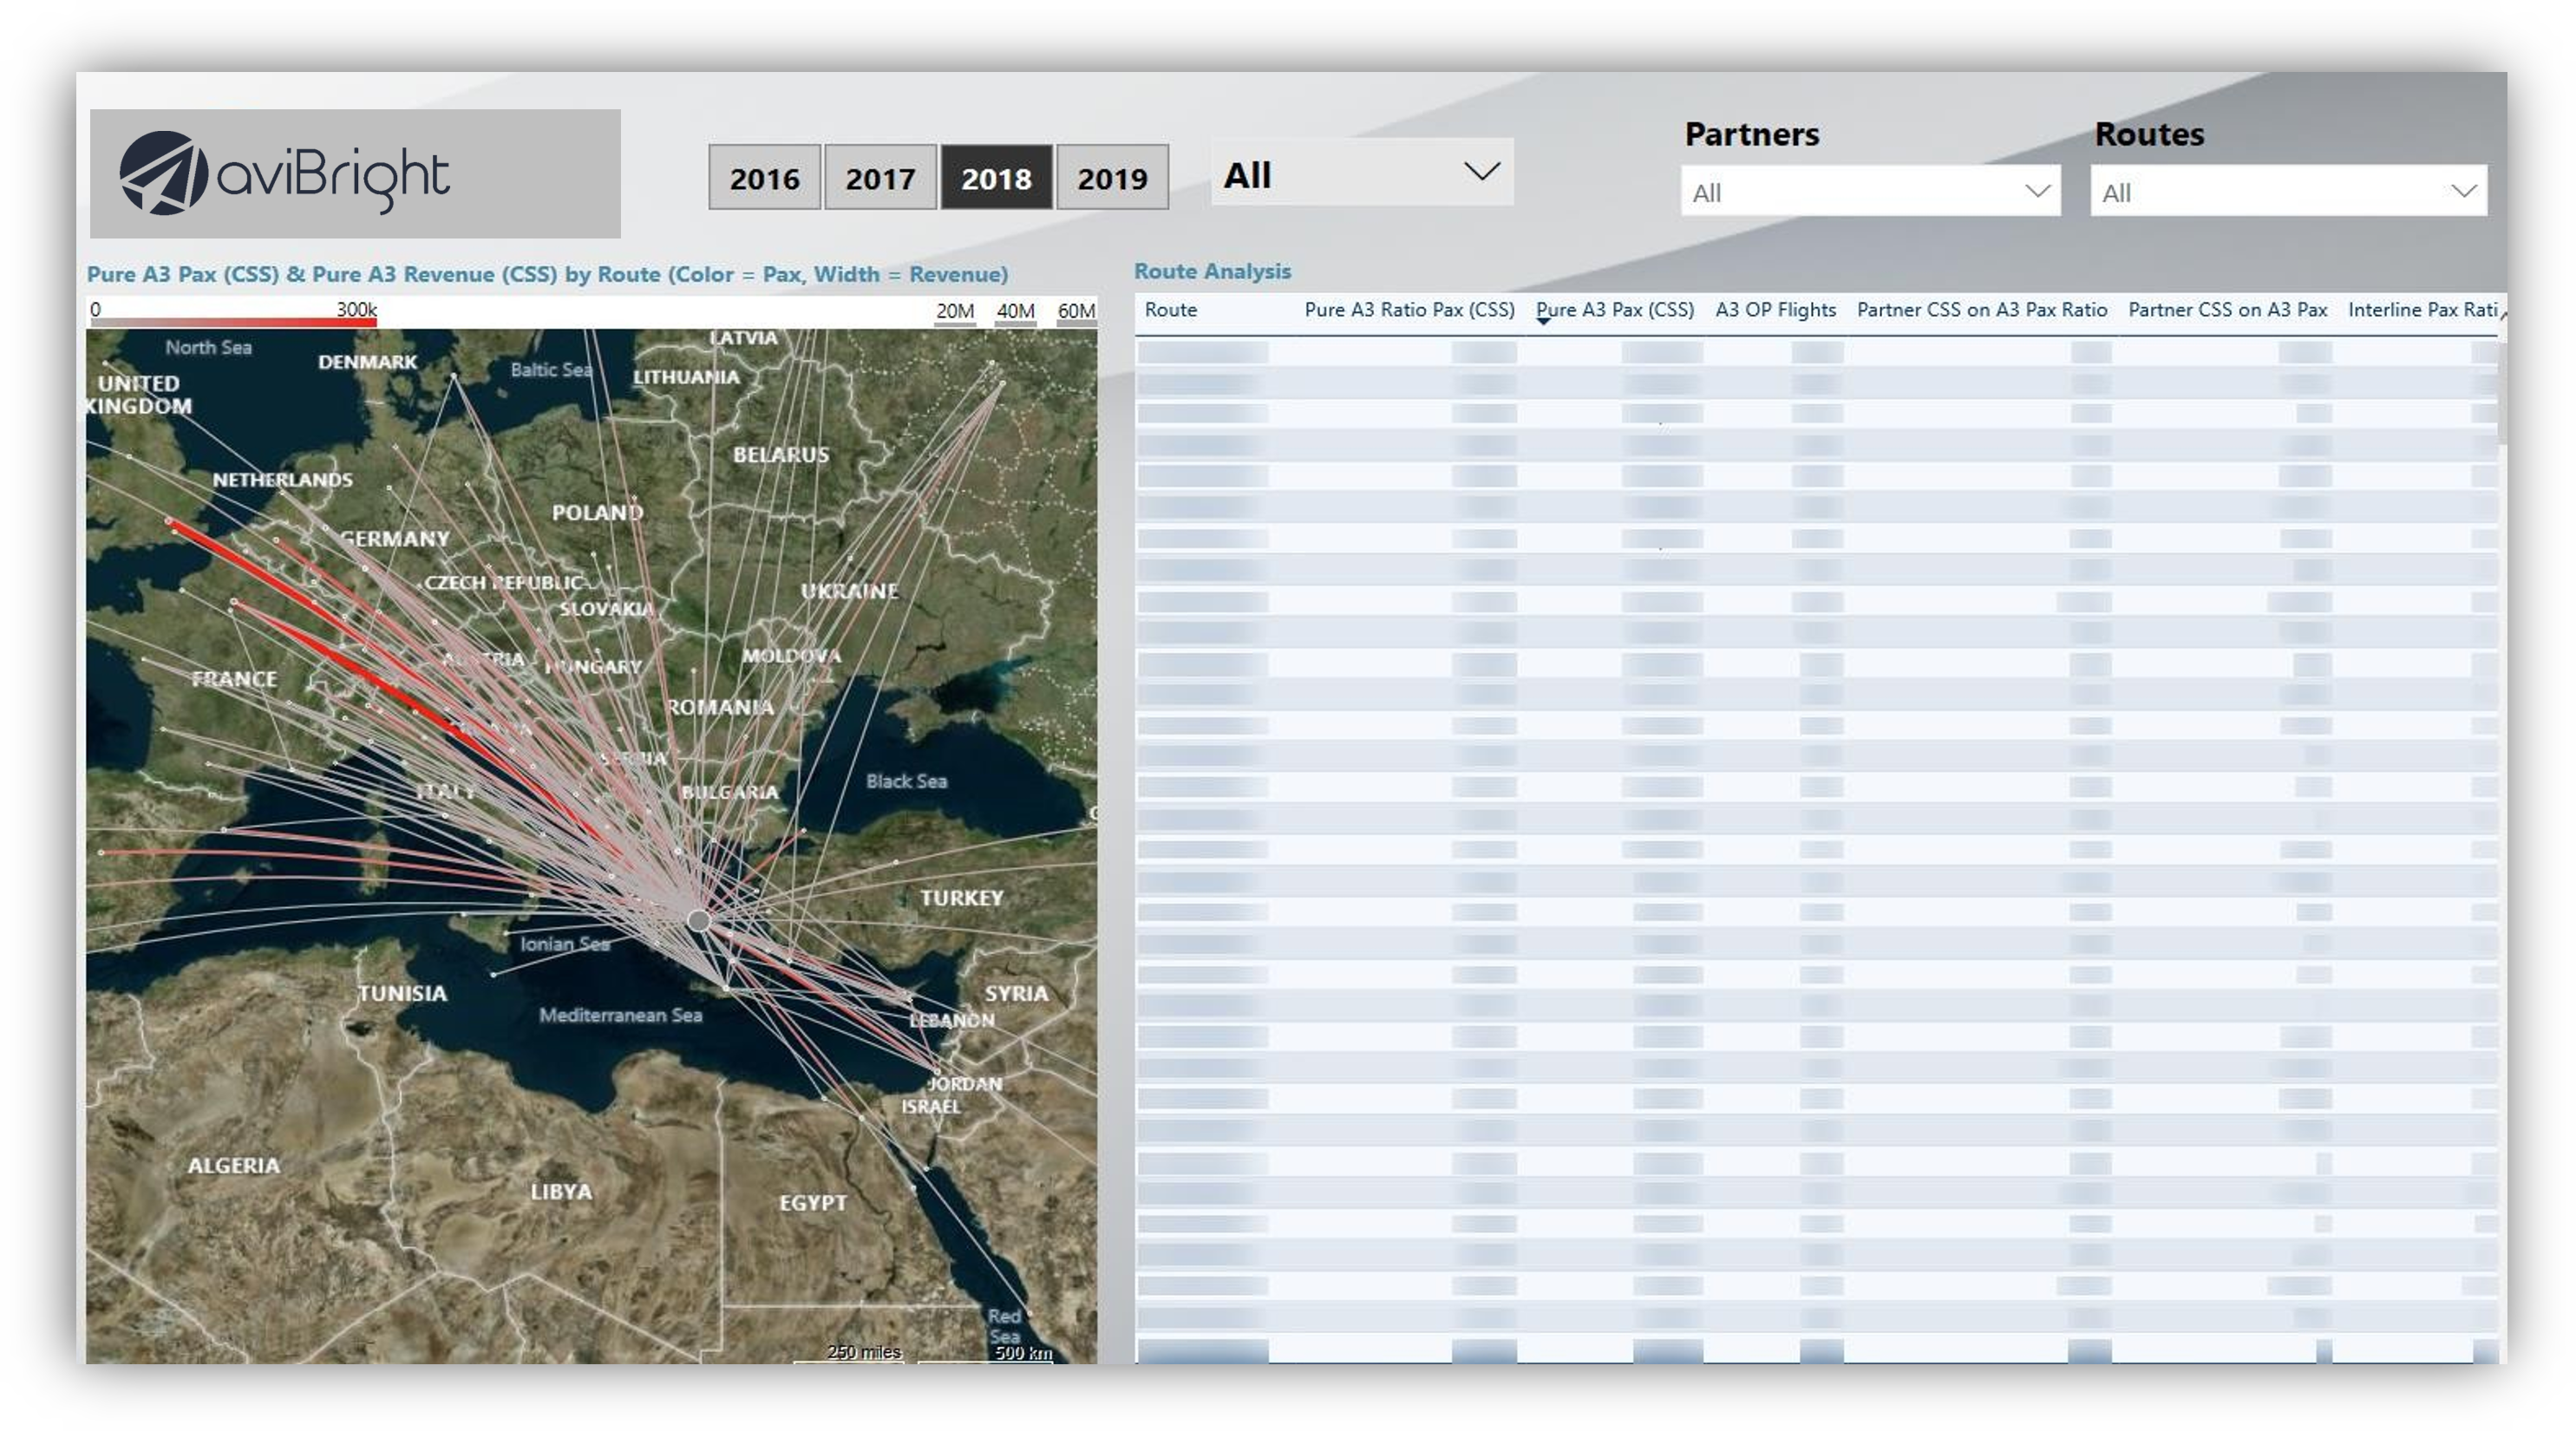
Codeshare Revenue Performance
- Partner’s Marketing Flights Revenue Contribution;
- Airline’s Marketing Flights Revenue Contribution;
- Codeshare Revenue Trendlines;
- Any other ratio or analyses required by the airline.
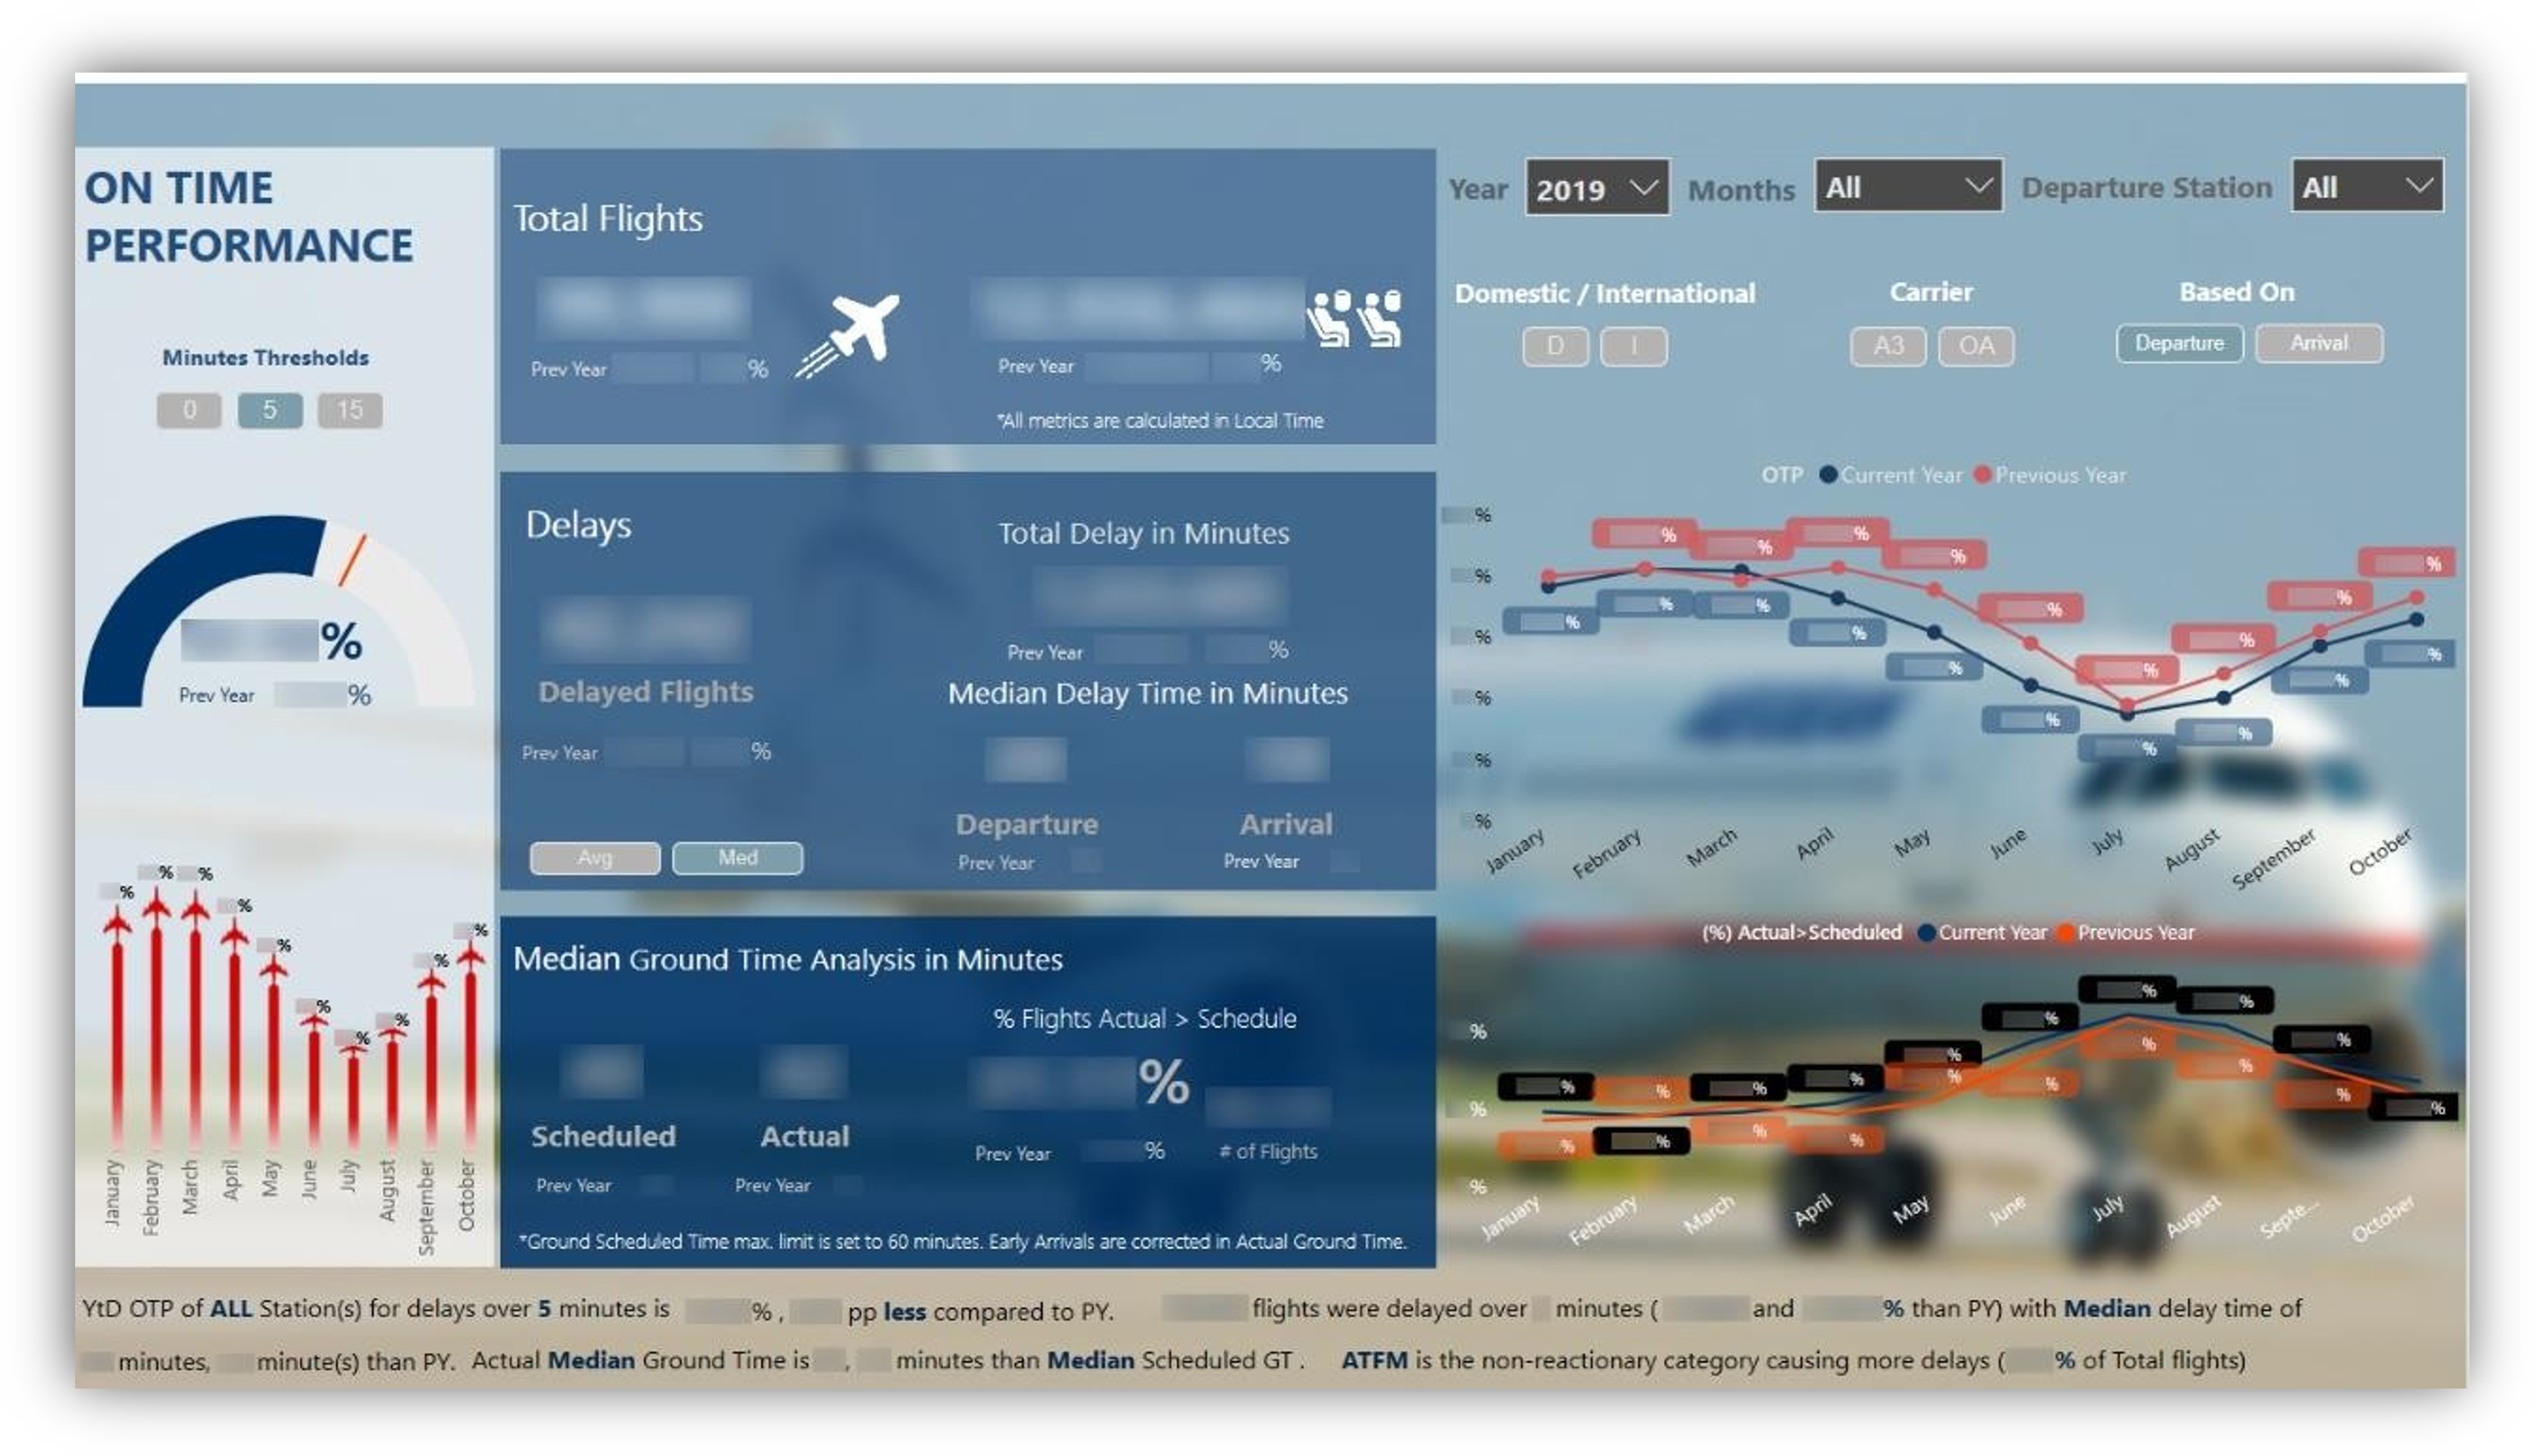
On-time Flight Performance
- General information on flights for selected year & month(s);
- Performance on 0′, 5′, 15′ VS previous period;
- On-time Performance Trendline VS previous period (many filters, such as fleet type);
- Any other ratio or analyses required by the airline.
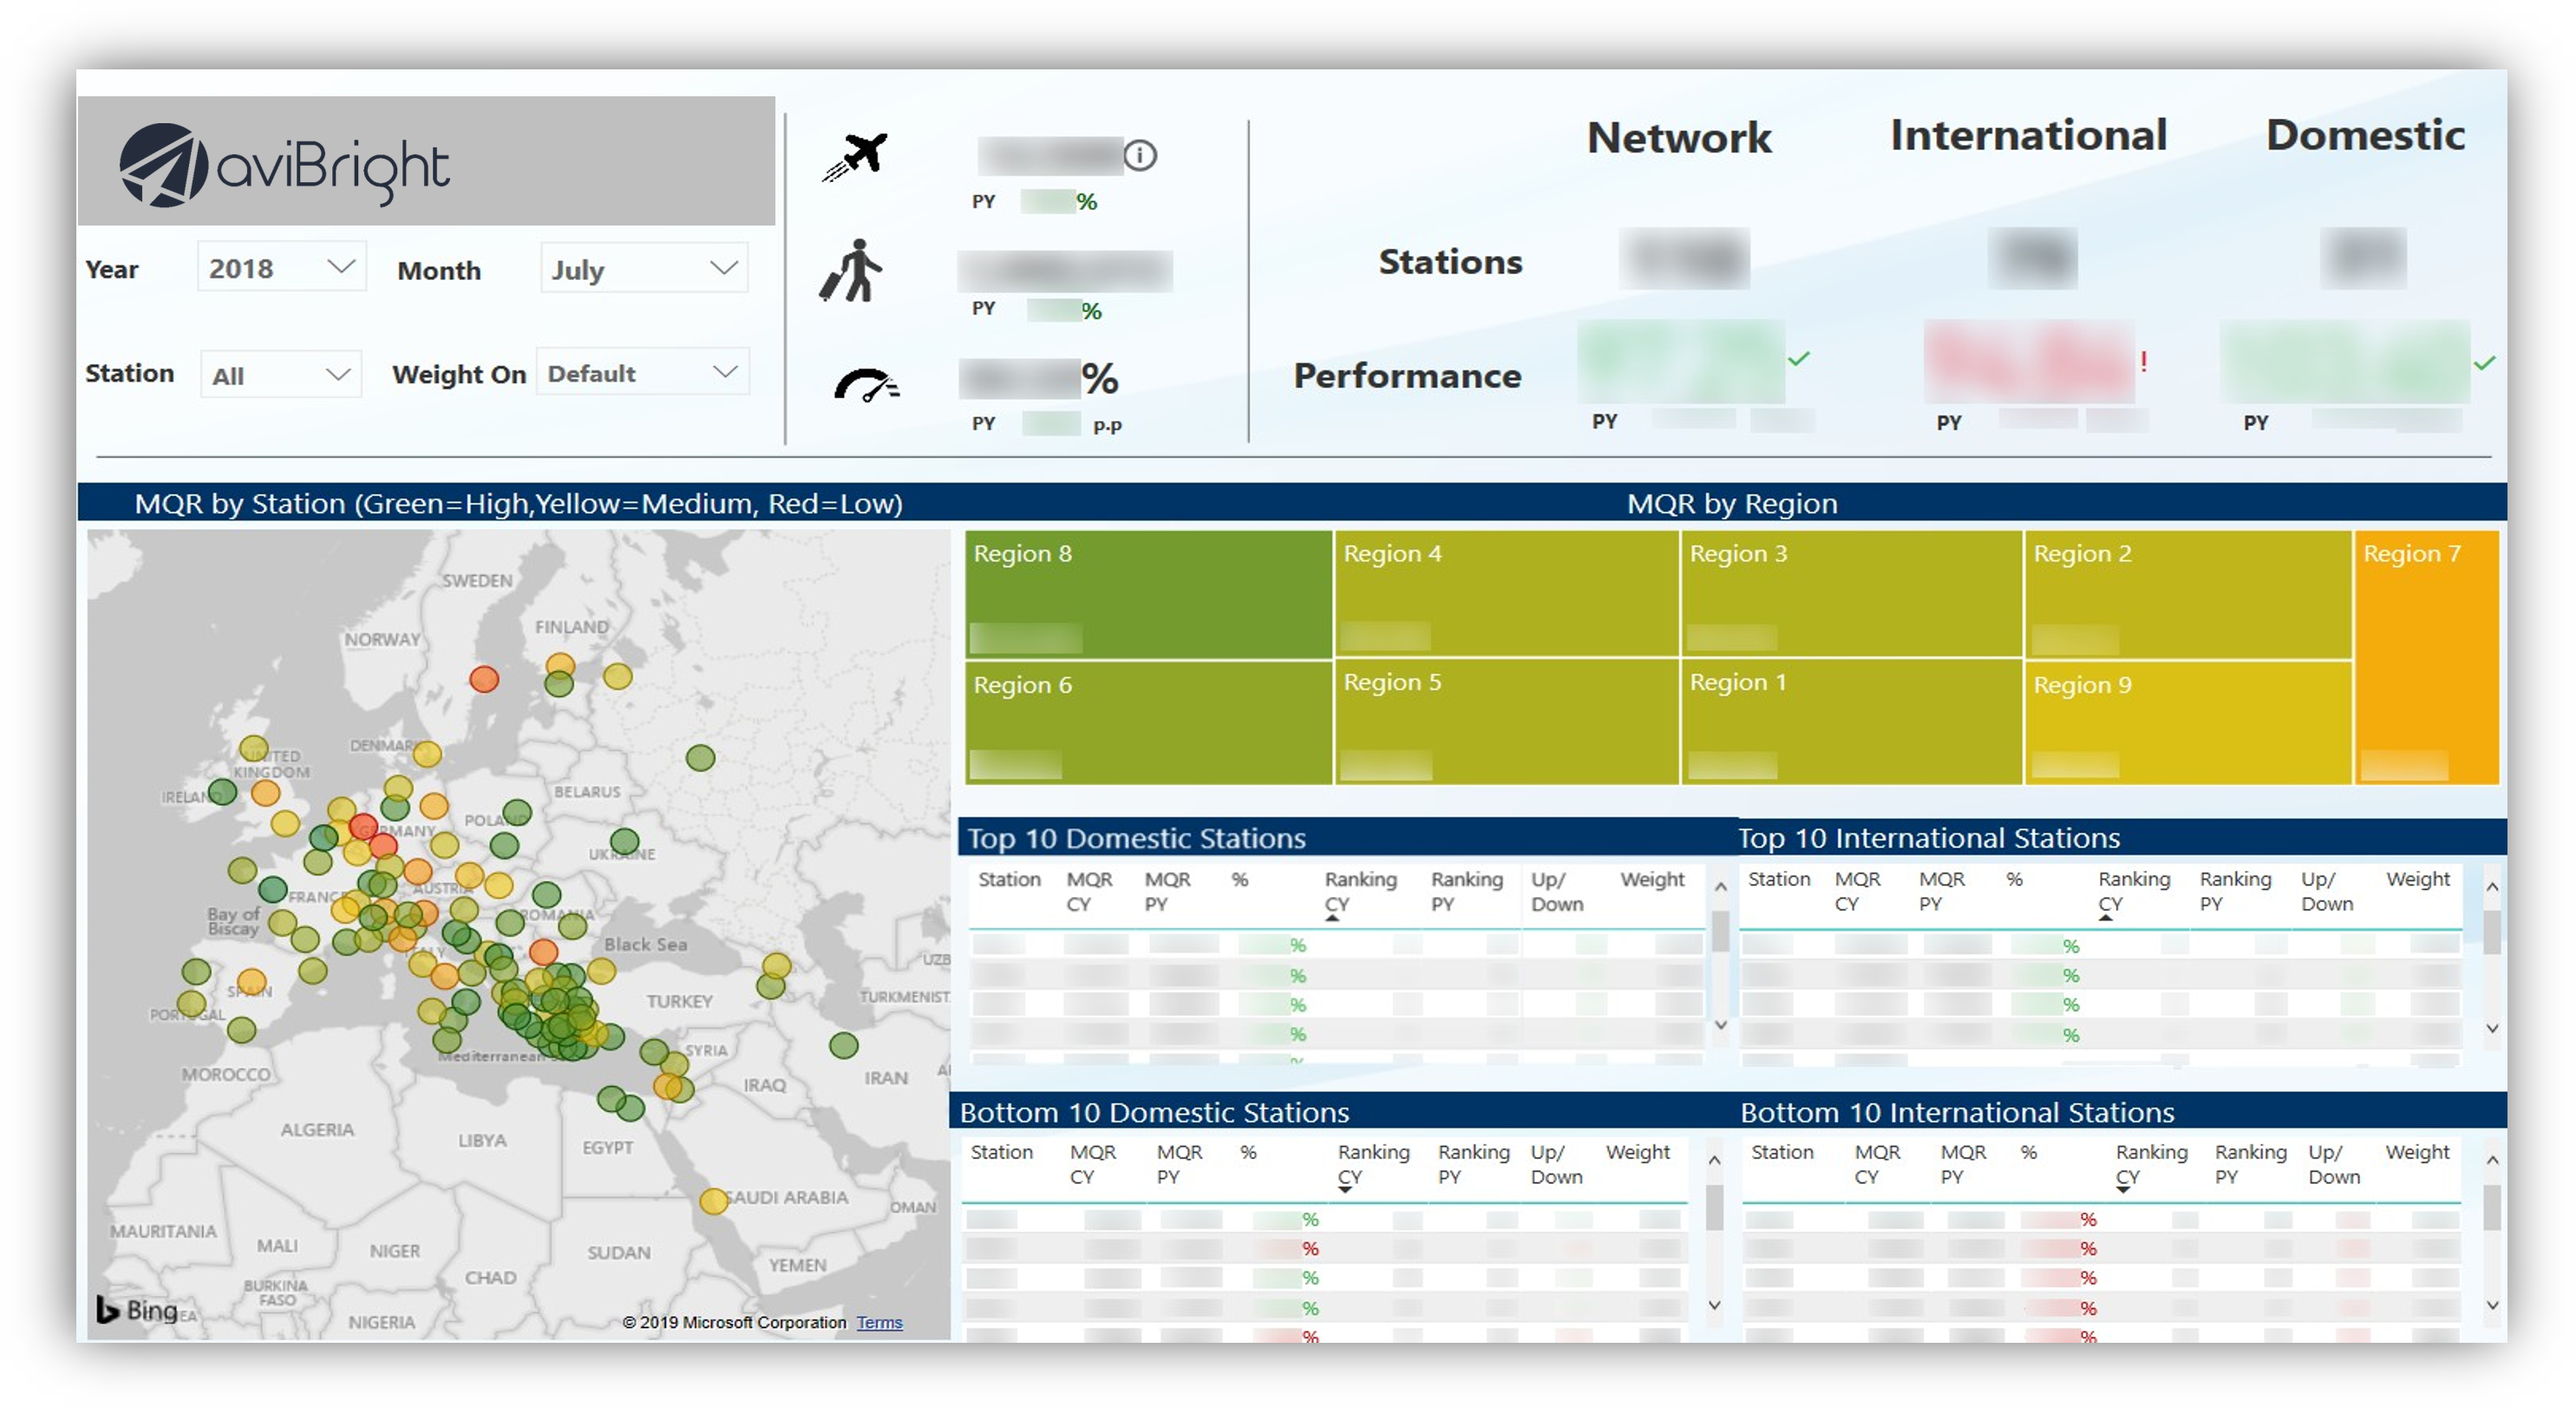
Station Monthly Quality Report (MQR)
- Region Performance;
- Map Visualization of Stations Ranking;
- Top/Bottom 10 Station Performance & Ranking;
- Punctuality & Baggage Delivery;
- MQR Variance (e.g. filtered by month);
- Safety Reports & Baggage Irregularities;
- Total Performance per Region;
- Region Stations Ranking;
- Any other ratio or analyses required by the airline.
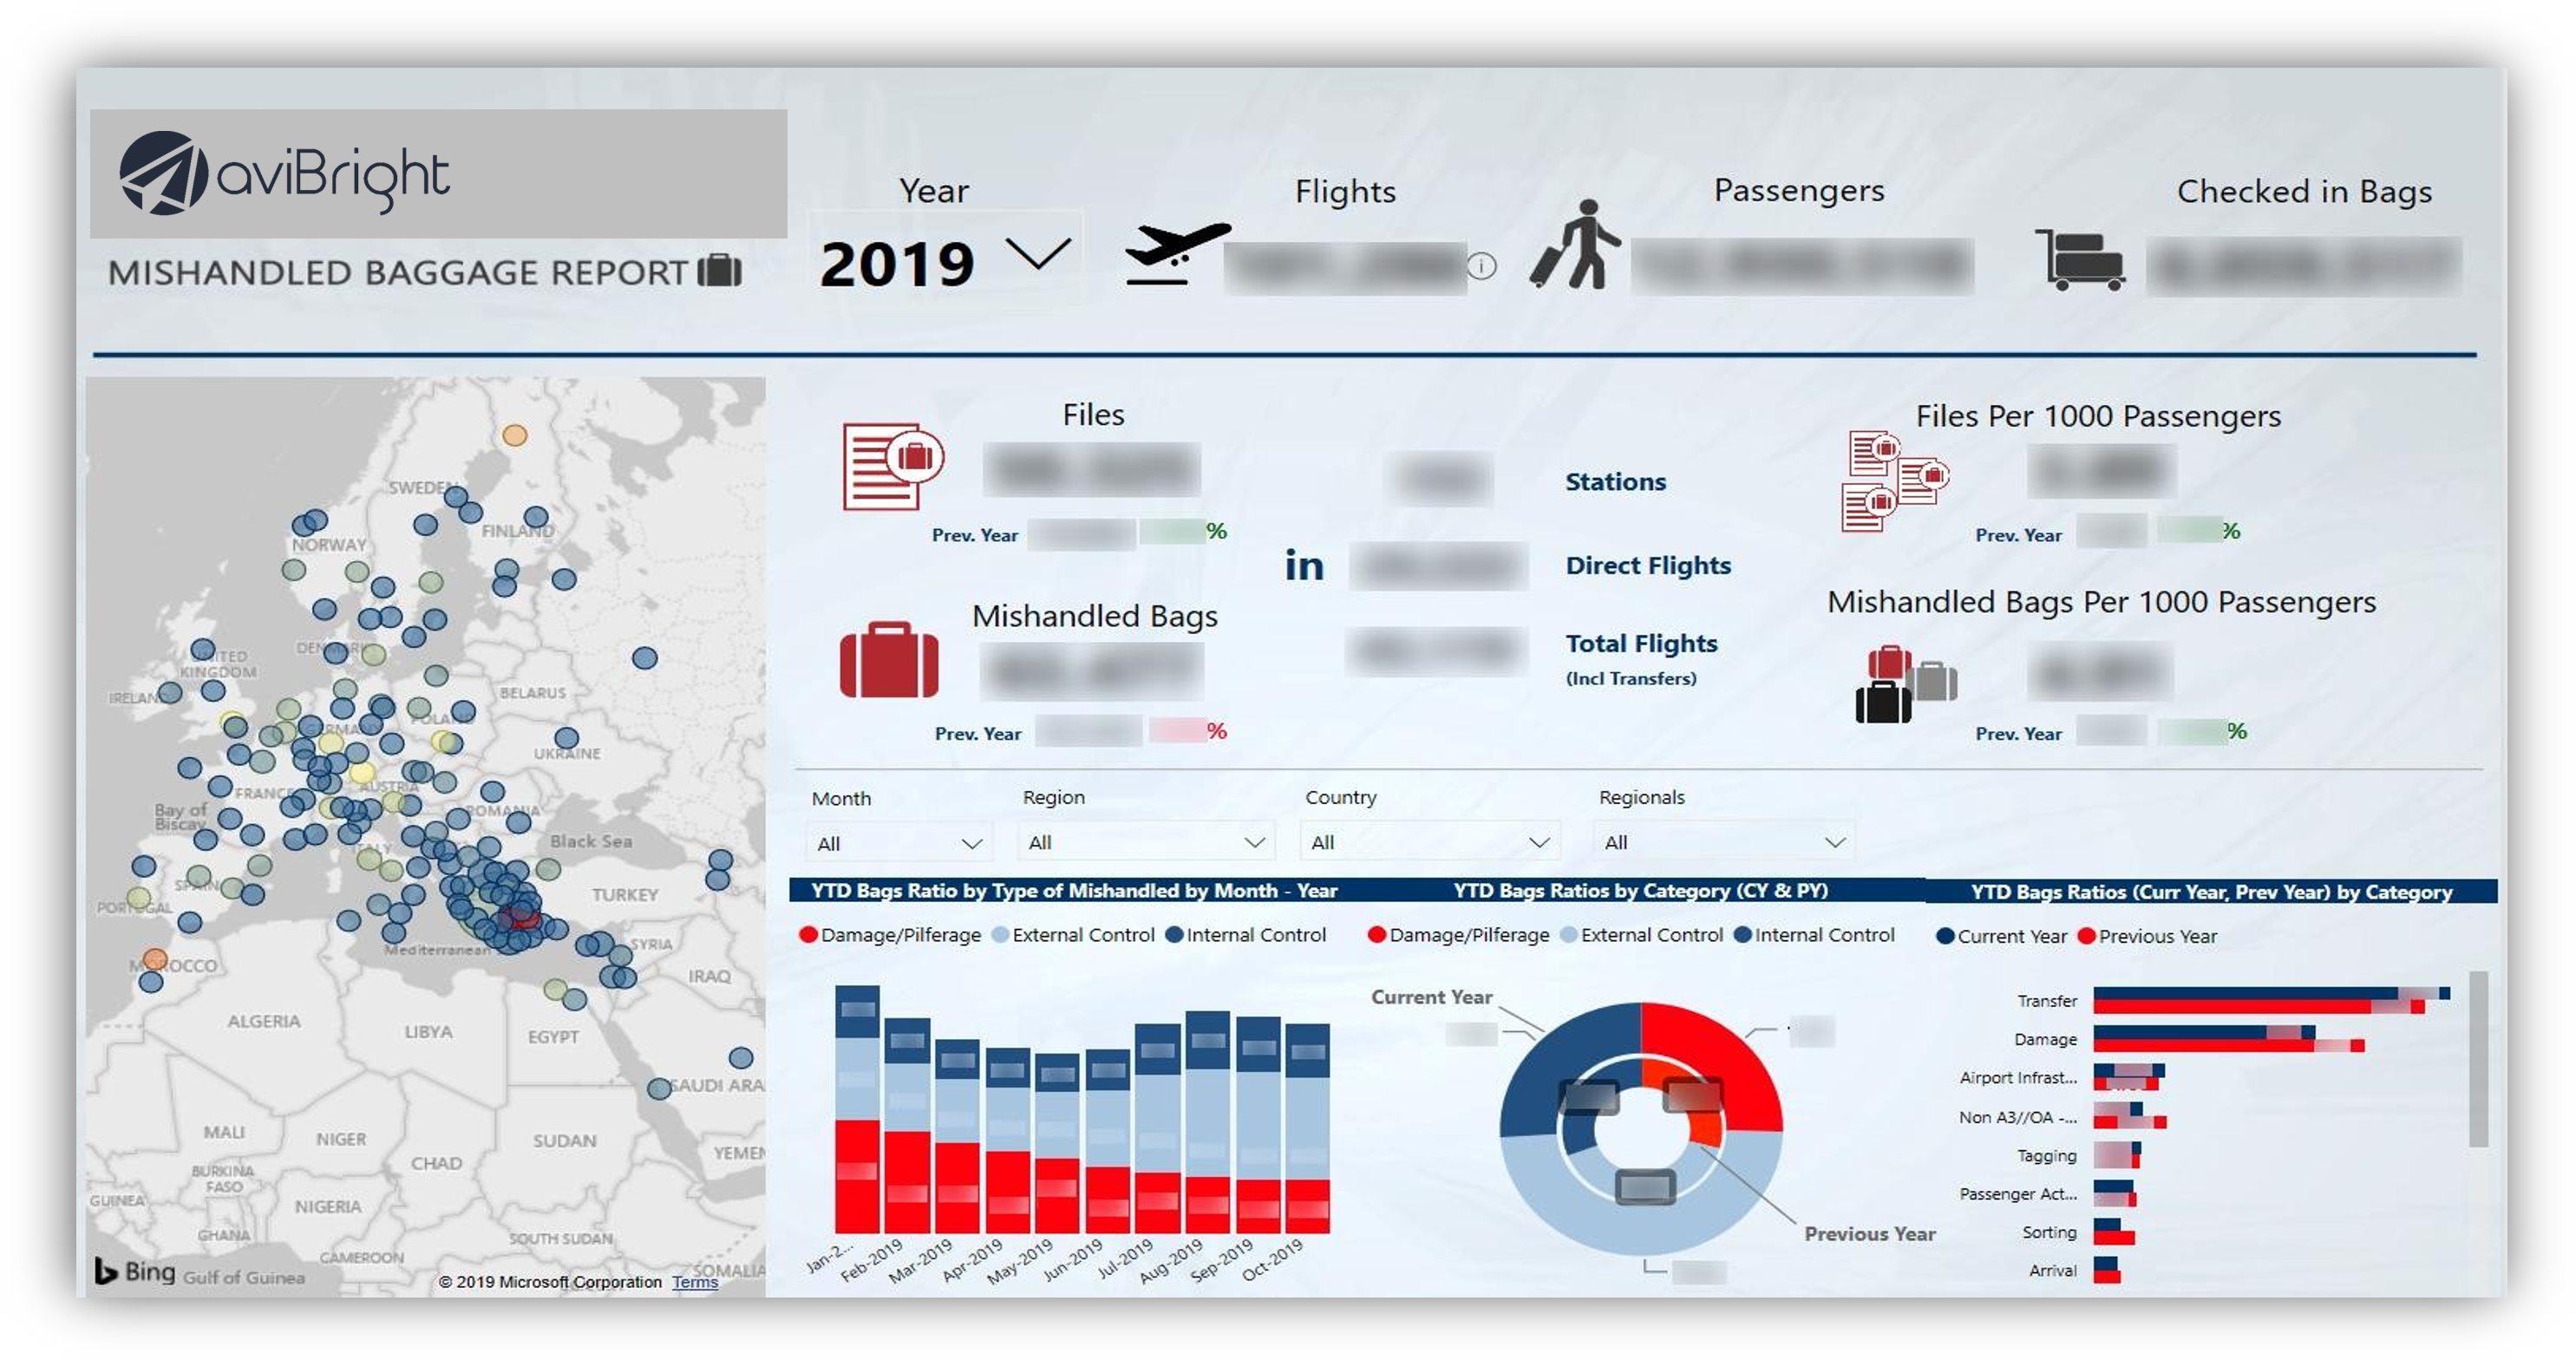
Mishandled Baggage Report
- Files & Bags Ratios (per Region & per Month);
- Incidents Reason Ratios;
- Incident Category Analysis;
- Any other ratio or analyses required by the airline.
