OPS360 – Turnaround Monitoring: At a Glance
OPS360 is avibright’s IOCC (Integrated Operations Control Centre) Turnaround Monitoring Platform for airlines. Designed to enhance operational efficiency and financial performance, it integrates real-time data from multiple sources into a comprehensive suite that delivers a unified view of operations.
By bringing together flight events, turnaround tasks, crew scheduling, maintenance activities and shift management onto a single platform, OPS360 enables better decision-making, improved situational awareness and greater adaptability to the constant changes of daily airline operations.
OPS360 is not a replacement for your existing systems. It is the integration layer that connects and harmonises what you already have — presenting a coherent, real-time operational picture to every stakeholder who needs it.
TECHNICAL OVERVIEW
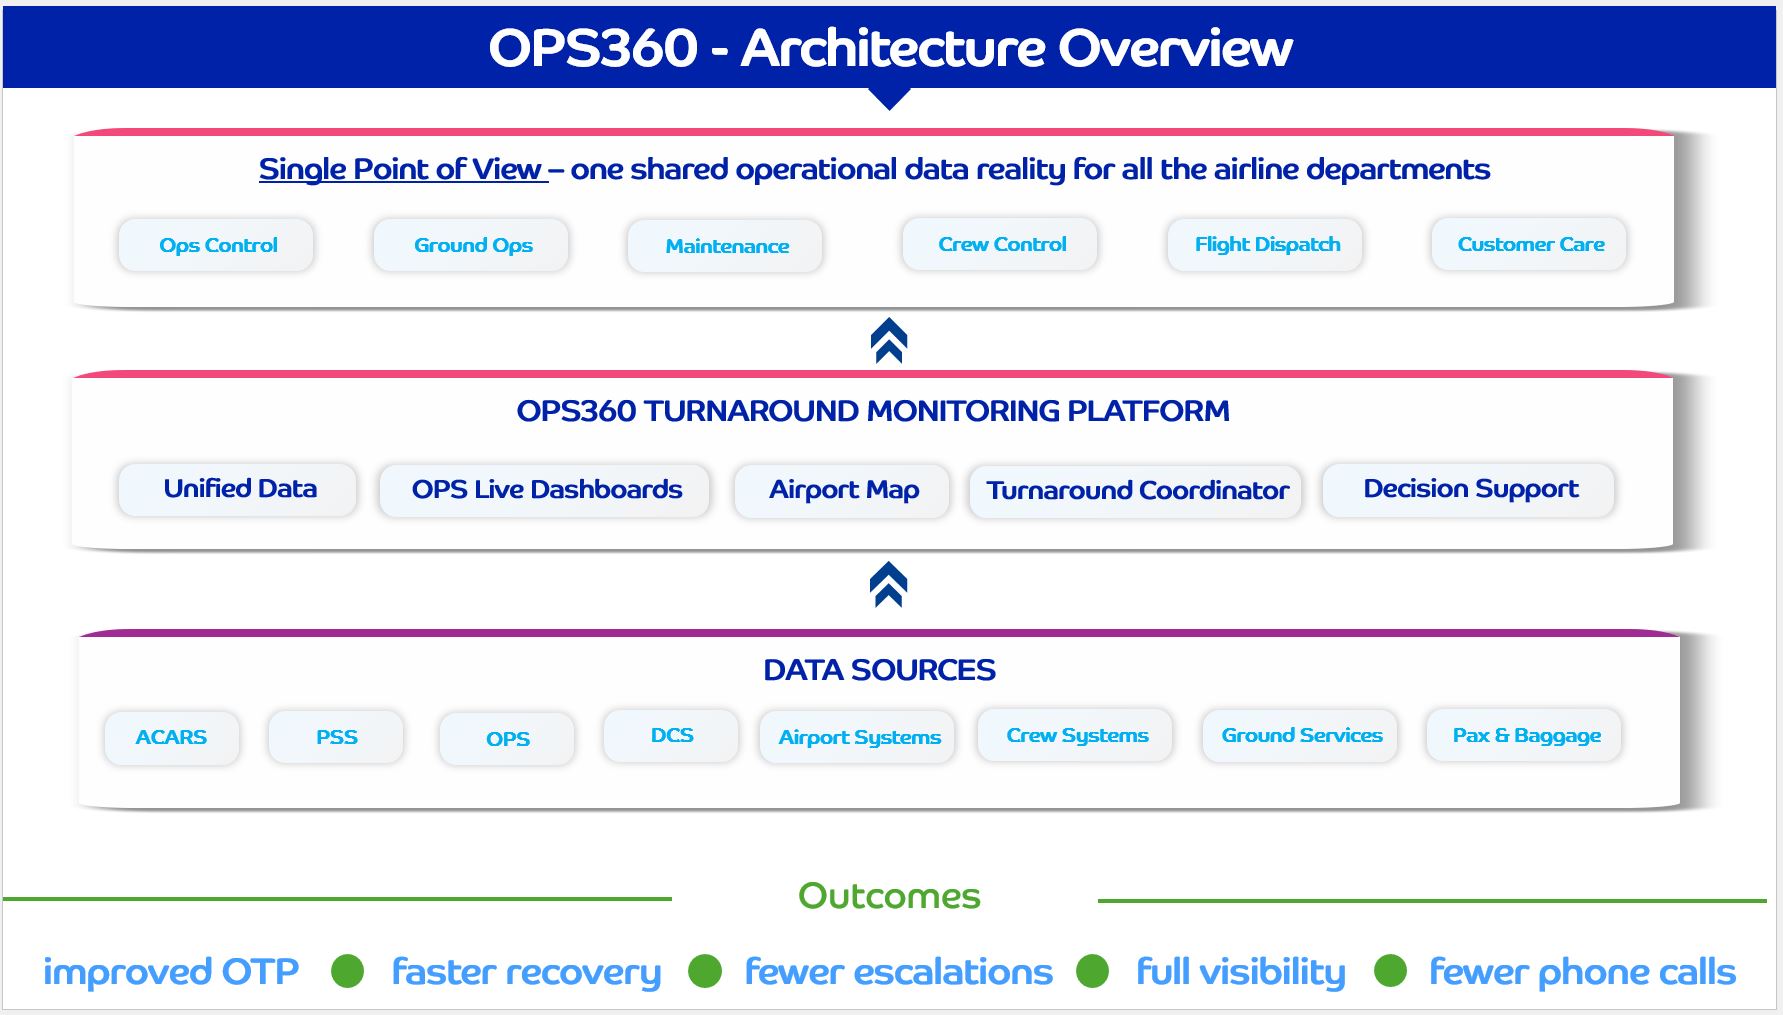
At the core of OPS360 is a unified data integration layer that collects, harmonises and distributes real-time data from multiple operational sources across all five modules simultaneously. Every module draws from the same live data pool, ensuring that every screen in the IOCC reflects the same operational reality.
OPS360 integrates with your existing technology stack — legacy airline systems, airport data feeds, crew management platforms, maintenance systems and ACARS — without replacing them.
DATA SOURCES & INTEGRATIONS
ACARS
PSS
OPS
DCS
Airport Systems
Crew Systems
Ground Services
Pax & Baggage
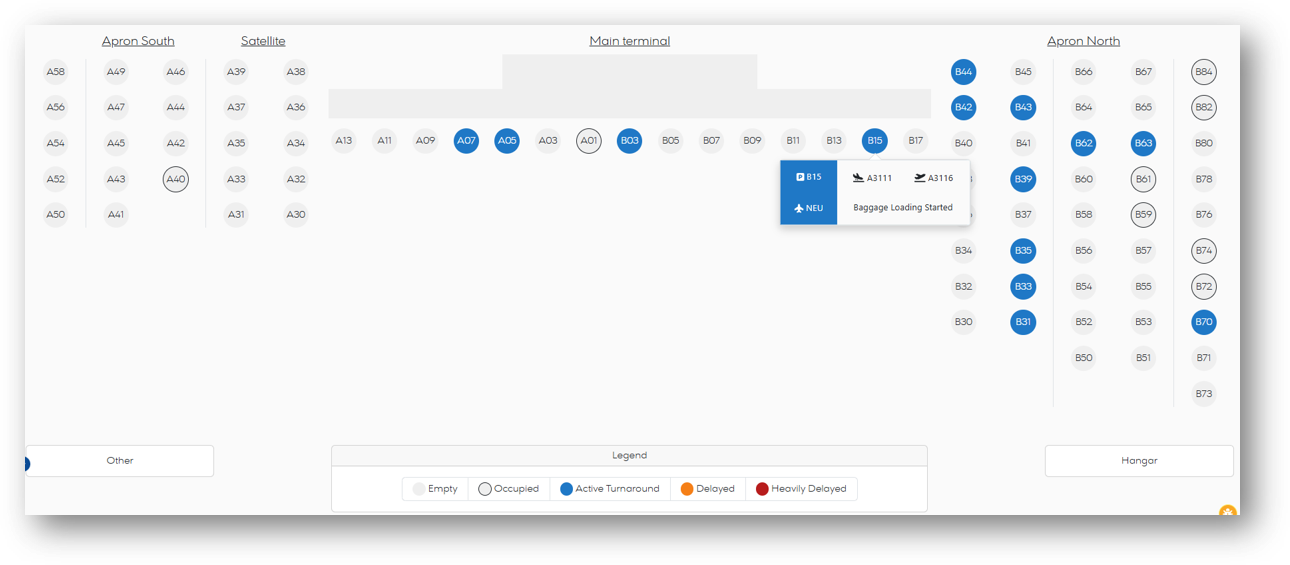
TURNAROUND MONITORING BASED ON AIRPORT MAP
HIGH LEVEL OVERVIEW: A live picture of every stand at a glance
The Airport Map is the operational starting point of OPS360. It displays all stands across every apron in real time — colour-coded by status so controllers can instantly assess the state of the entire airport without navigating between systems.
Each stand updates live as turnaround events are recorded, and a tooltip on any active stand provides an immediate summary of the flights and the most recent turnaround event — for example Baggage Loading Started — enabling rapid scanning of the full airport operation at any moment.
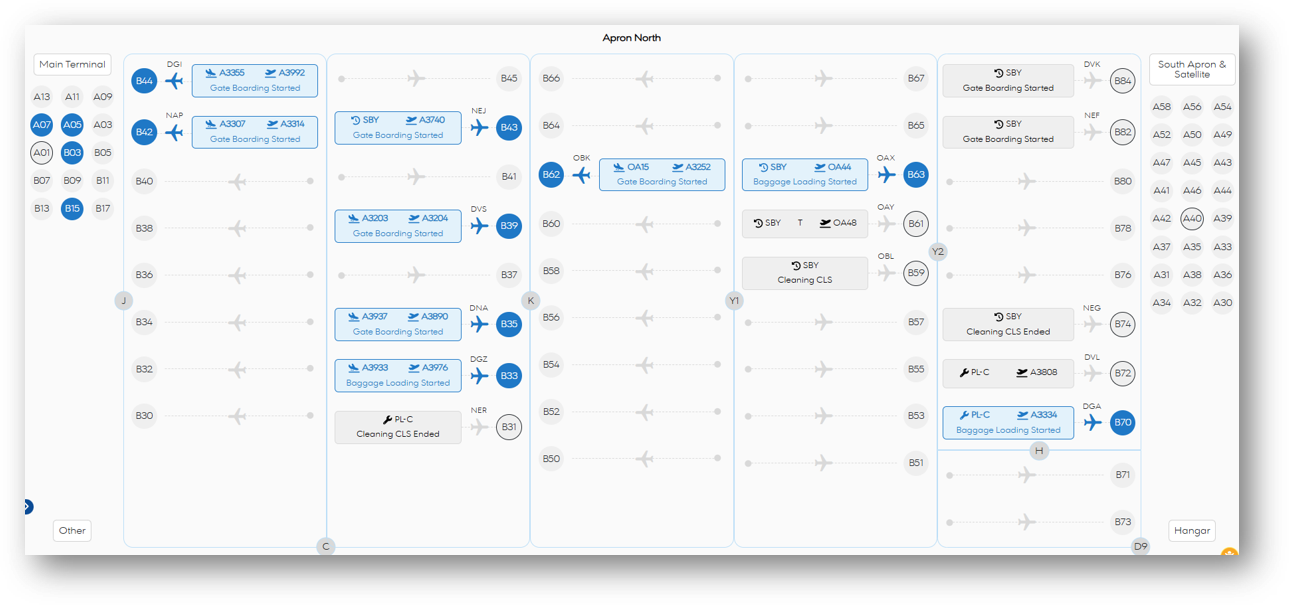
DETAILED STAND VIEW: Paired flights and live status per stand
The detailed Airport Map view expands each active stand to show the complete turnaround context: the inbound and outbound flight numbers side by side, the aircraft type and the current turnaround event in plain language.
This is the working view for IOCC controllers who need to monitor multiple concurrent turnarounds simultaneously — identifying at a glance which stands require immediate attention and which are progressing normally, without opening individual flights.
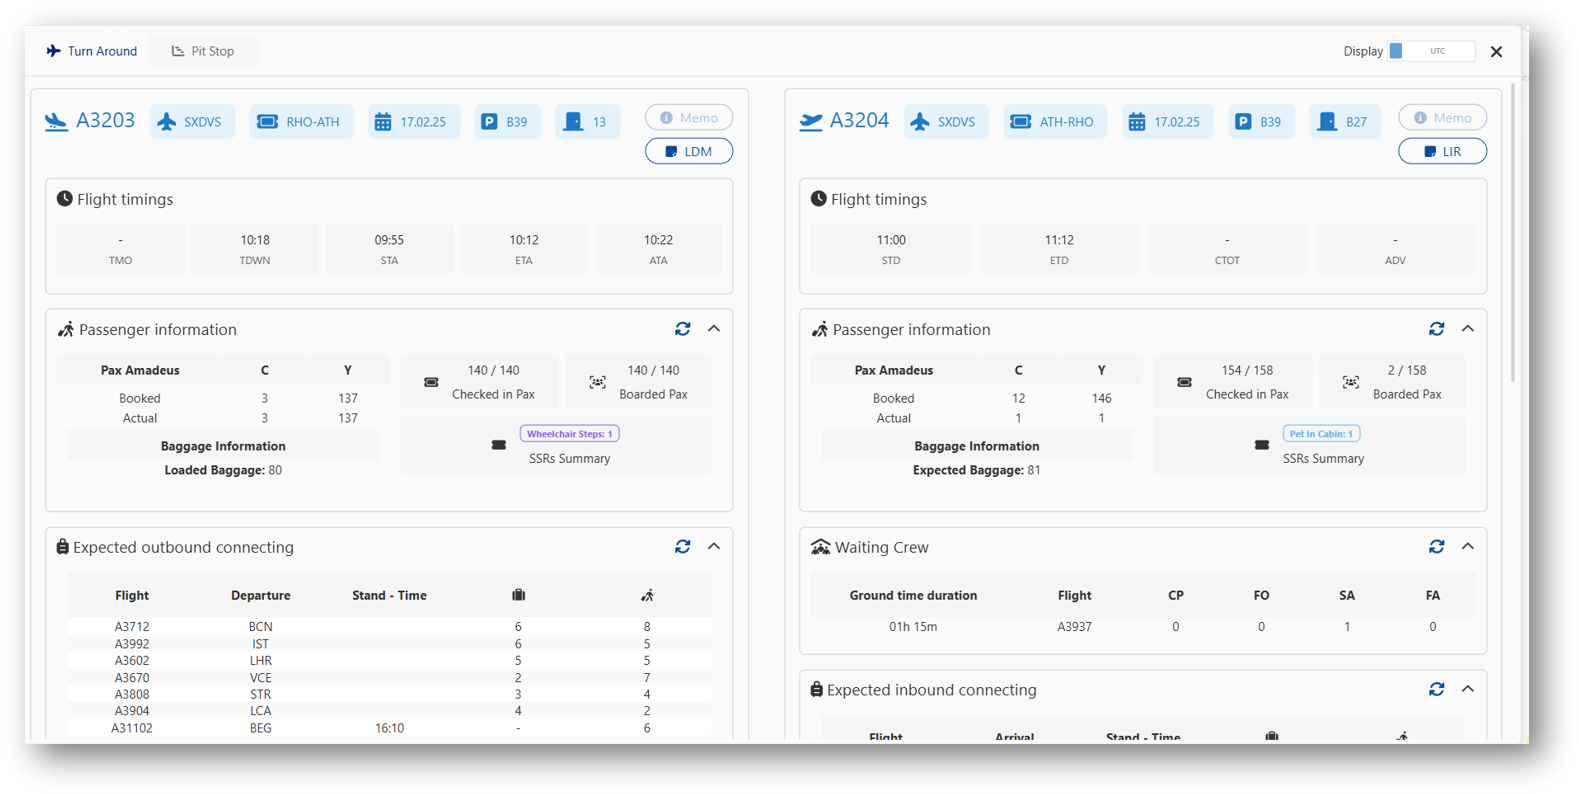
FLIGHT PIT STOP: Every detail of the turnaround — in one screen
Flight Pit Stops is the detailed operational interface used by OCC agents and ground handler ramp teams.
The OCC agents’ interface presents the inbound and outbound flight details side by side.
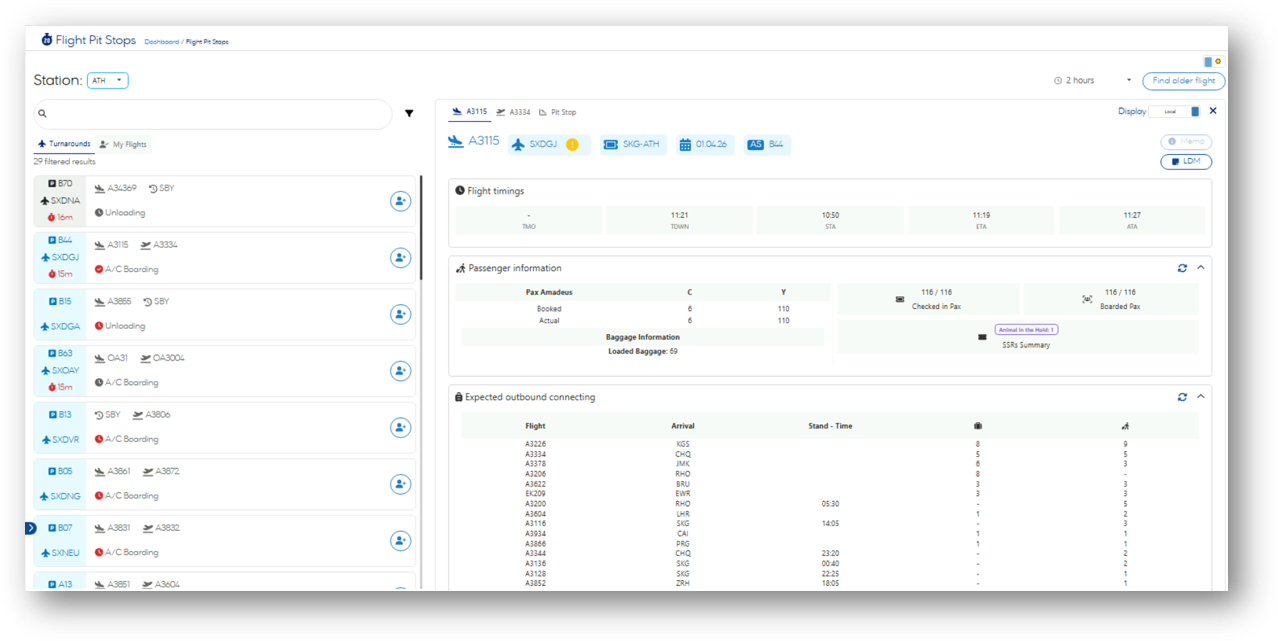
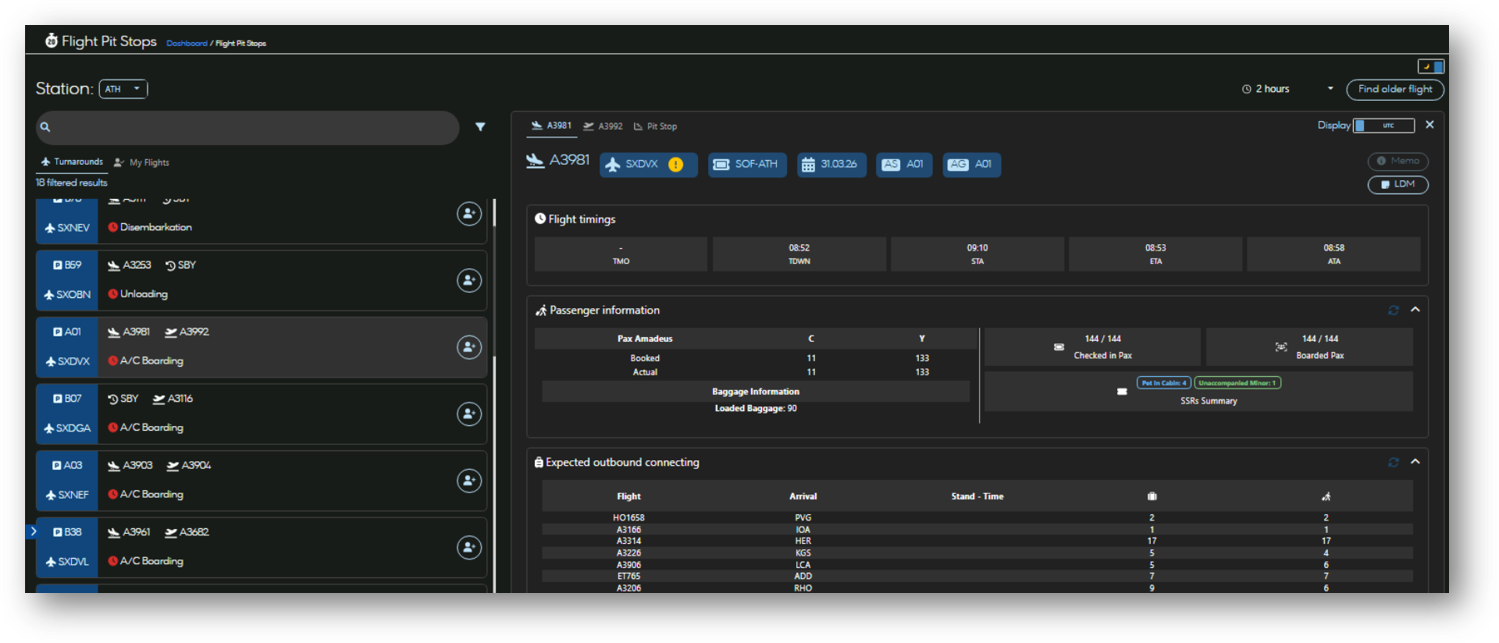
The ramp agents’ interface (mobile responsive app) presents a station-based list of all active turnarounds on the left, and the full detail of any selected flight on the right — all in a single, unified view that eliminates the need to switch between systems.
The interface supports both dark and light display modes and is accessible by station, allowing ramp teams at any airport to view only the flights relevant to their operation. A My Flights tab provides each user with a personalised list of their assigned turnarounds, and a Find older flight function gives access to historical turnaround data.
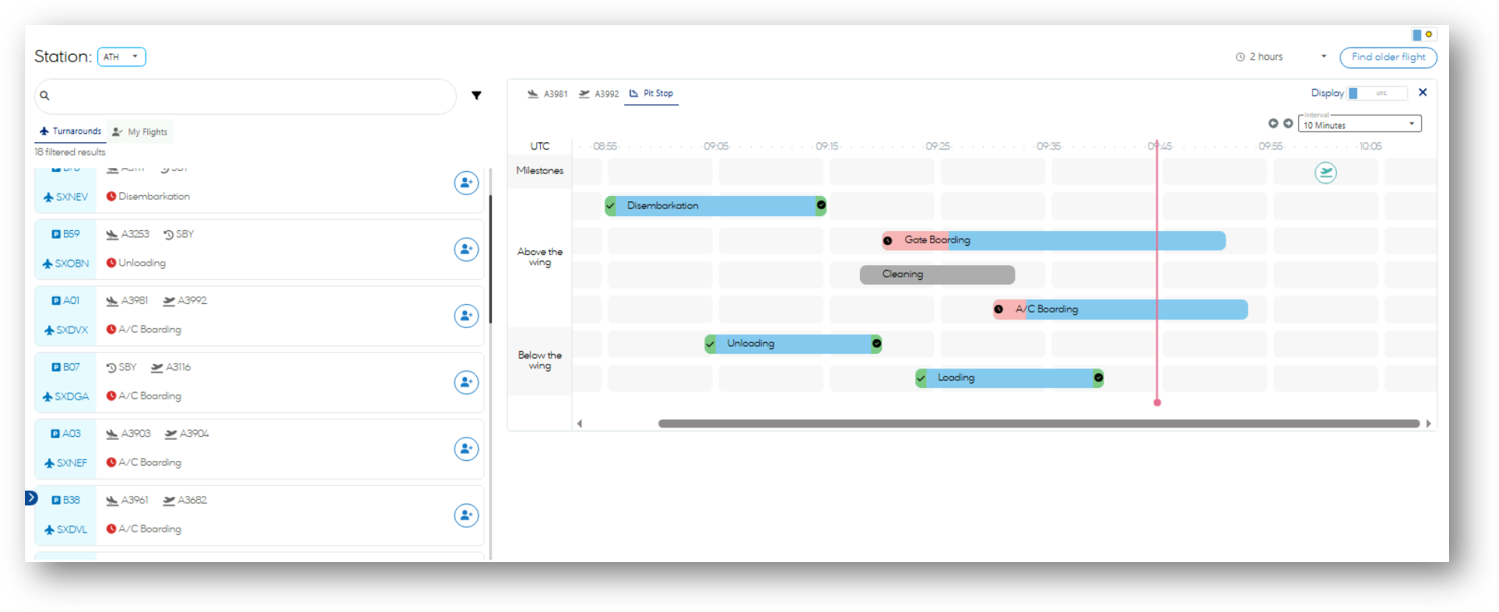
PIT STOP TIMELINE: Live turnaround milestones — above and below the wing
The Pit Stop tab within Flight Pit Stops opens the live milestone timeline — a Gantt-style view of all turnaround activities on a rolling UTC timeline. It is used by both OCC agents and ramp teams to track exactly where each turnaround stands against its planned schedule, milestone by milestone.
Activities are separated into two clear layers, reflecting the operational reality of ground handling: Above the wing covers the passenger-side processes, and Below the wing covers the ramp-side processes. This separation makes the critical path immediately visible — controllers can see instantly whether the passenger side or the ramp side is driving the outbound delay.
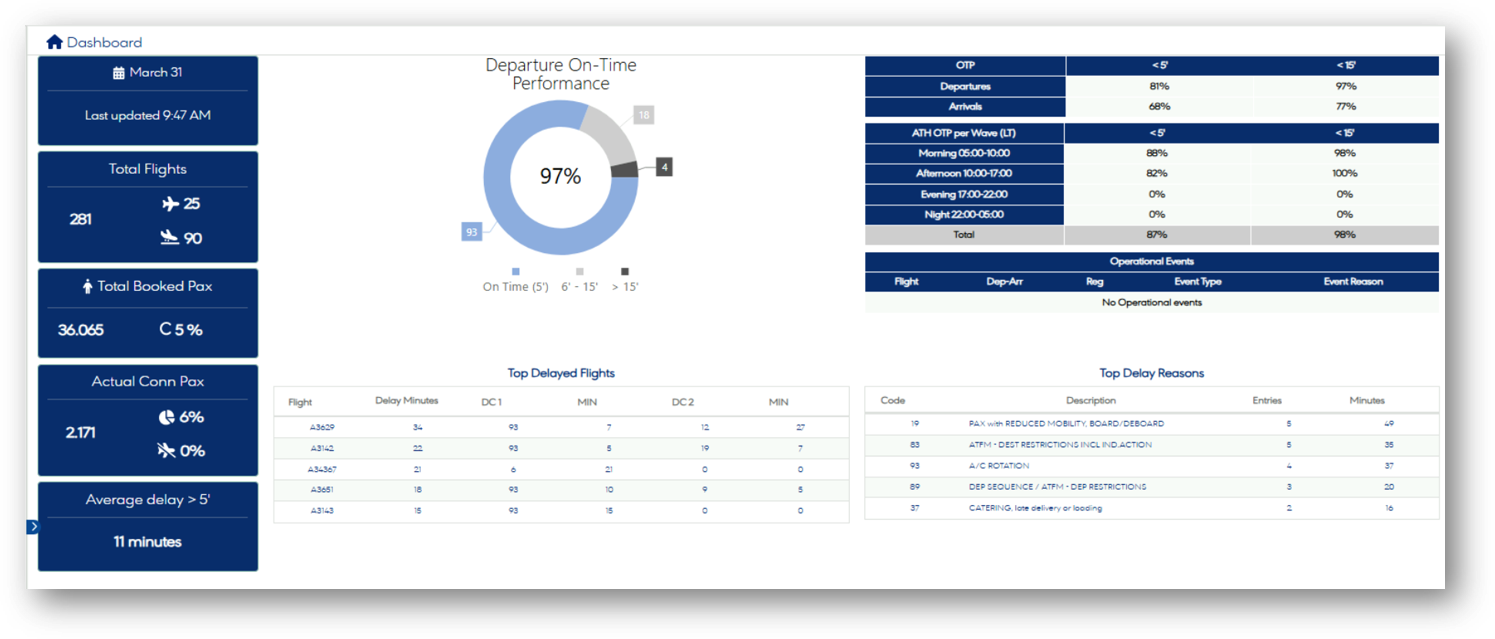
LIVE DASHBOARD: Operational KPIs — the full day of operations picture
The Live Dashboard is the high-level command view of OPS360 — a single screen that gives IOCC managers and controllers an immediate read on the health of the day’s operation. Updated in real time, it brings together flight counts, passenger totals, on-time performance and delay intelligence in one unified display.
The dashboard is organised into four areas: a left KPI panel for key operational numbers, a central OTP donut chart for instant performance assessment, a top-right OTP breakdown table by flight direction and wave, and bottom tables for the top delayed flights and top delay reasons.
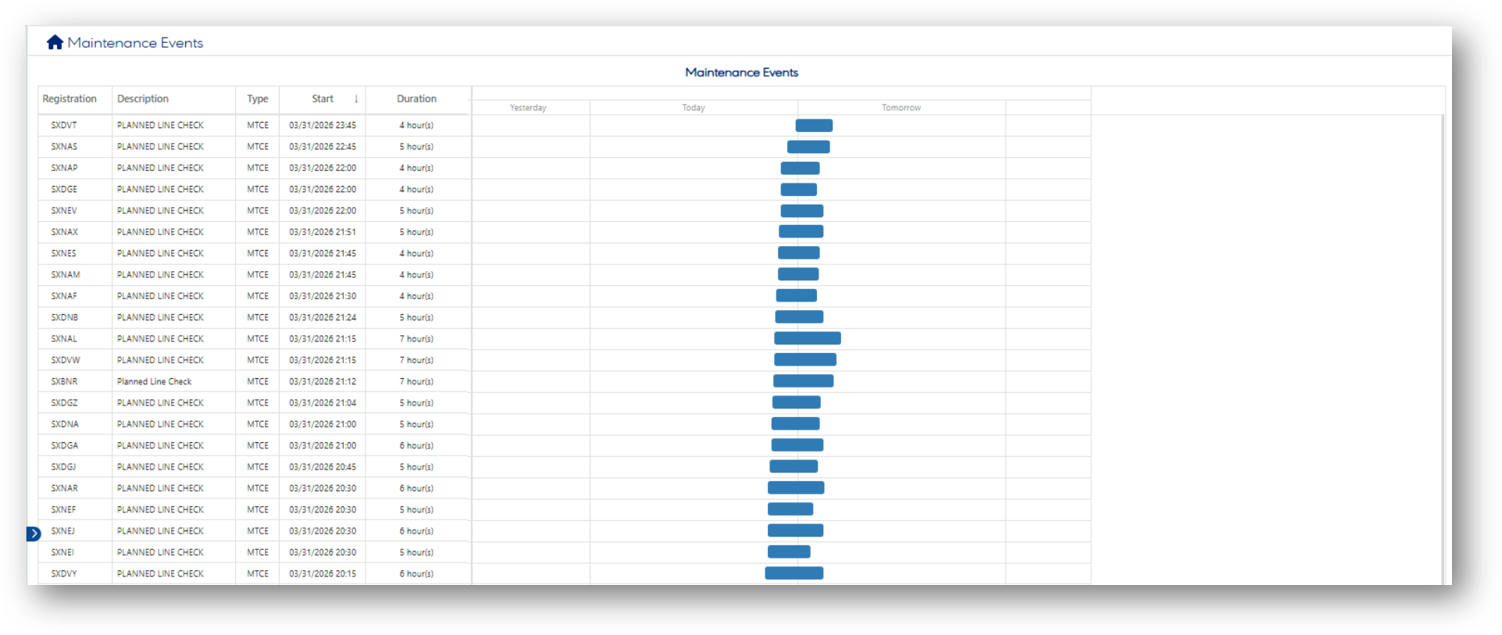
MAINTENANCE EVENTS: Planned maintenance across the fleet — at a glance
The Maintenance Events view gives OCC agents immediate visibility of all planned maintenance activities across the fleet. Presented as a combined data table and Gantt-style timeline spanning yesterday, today and tomorrow, it ensures that every controller handling turnarounds is aware of the maintenance picture — without having to consult a separate system.
For the OCC, knowing which aircraft registrations are committed to maintenance — and for how long — is essential context when making decisions about aircraft rotation, stand allocation and disruption recovery. OPS360 surfaces this information directly within the operational workflow, as part of the same single point of truth that drives the Airport Map and Flight Pit Stops views.